If you love visual metrics, then IntelliApp Statistics was made for you. Our IA Stats service provides visibility and transparency into the performance of your IntelliApp through the use of pie charts, bar graphs, and line graphs – allowing you to make informed decisions about your hiring process.
Getting your data in such a clear format helps you cut through the noise of too much information and find the clear signal that should guide your hiring.
 Track the number of weekly applications each member of your IntelliApp family has procured with the Applications Statistics bar graph on the left. You can also conveniently click through to each of your applications to ensure they’re always up-to-date and accurate.
For an at-a-glance view of the types of applicants you’re receiving, Portal Statistics on the right guides the way. This graph offers a breakdown of how many of your applicants are reapplies, how many have had previous experience (allowing them to take advantage of the time-saving pre-population feature), and how many applicants are new drivers.
 The Real-Time IntelliApp View gives you access to your candidates and the application process in real time, as the application is being completed. Having the ability to see key details – such as experience, accidents, and violations – allows you to reach out to a driver immediately when you see a good fit.
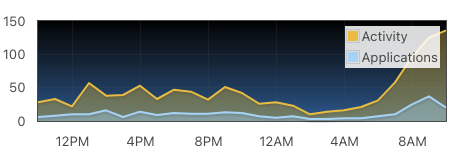
 Make smart staffing decisions by tracking your application’s busiest and slowest times – by activity level, and by completed application level – with the IntelliApp Activity graph.
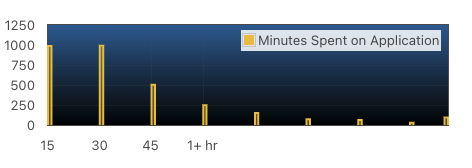
 Want to know how long drivers typically take to complete an application? The Time Per Completed Applications graph breaks it down for you on a weekly basis, so you can keep tabs on your IntelliApp, ensuring it can always be completed quickly and easily, just as it was meant to be.
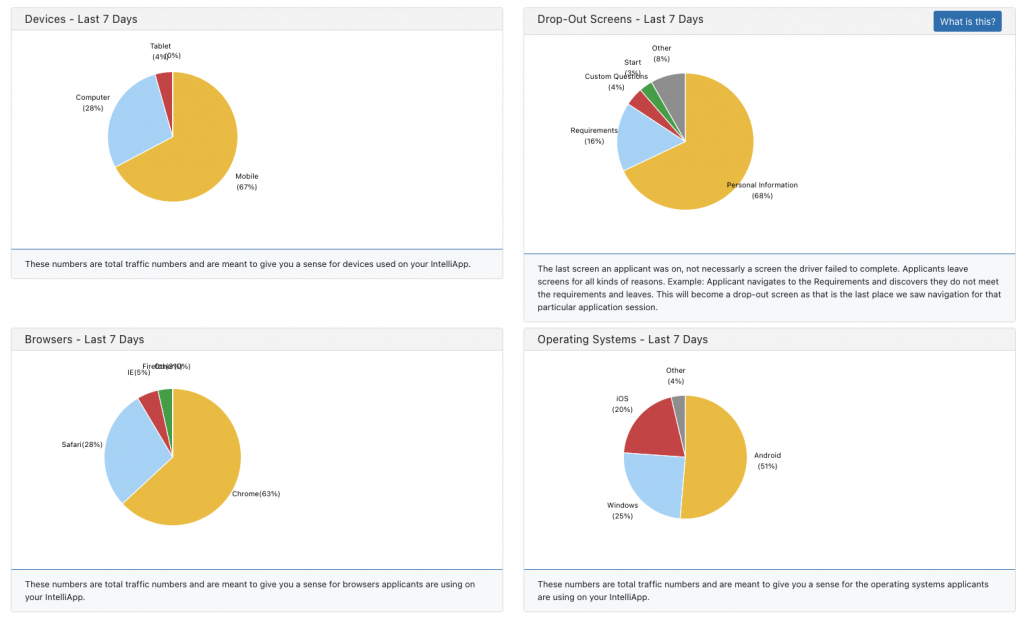
 These four pie charts show you a detailed count and percentage view of what devices your applicants are using when they apply, what screen(s) they’re most likely to drop out of during the application process, which browsers they’re using, and what operating systems they’re on.
These aggregates allow you to make well-informed decisions about your application to support your applicant base and grow your business. For example, if you know where people are dropping out of your application, you might consider making that section shorter. And if you know what devices and browsers your applicants are using, you can ensure your marketing content is optimized for those platforms.
[email protected] to learn more!
Key Features
- Track application statistics for each of your applications (IntelliApp, Signature, Mobile, or Micro)
- Discover where in the application your applicants are most likely to drop out
- Follow device, browser, and operating system trends to get a better understanding of your applicant base
- Gain access to your incoming IntelliApps in real time, as they’re being completed
- Understand your mobile population to help drive advertising and marketing efforts
Follow Eight Key Performance Metrics
IntelliApp Statistics – Last 7 Days
 Track the number of weekly applications each member of your IntelliApp family has procured with the Applications Statistics bar graph on the left. You can also conveniently click through to each of your applications to ensure they’re always up-to-date and accurate.
For an at-a-glance view of the types of applicants you’re receiving, Portal Statistics on the right guides the way. This graph offers a breakdown of how many of your applicants are reapplies, how many have had previous experience (allowing them to take advantage of the time-saving pre-population feature), and how many applicants are new drivers.
Real-Time IntelliApp View
 The Real-Time IntelliApp View gives you access to your candidates and the application process in real time, as the application is being completed. Having the ability to see key details – such as experience, accidents, and violations – allows you to reach out to a driver immediately when you see a good fit.
IntelliApp Activity – Last 24 Hours
 Make smart staffing decisions by tracking your application’s busiest and slowest times – by activity level, and by completed application level – with the IntelliApp Activity graph.
Time Per Completed Applications – Last 7 Days
 Want to know how long drivers typically take to complete an application? The Time Per Completed Applications graph breaks it down for you on a weekly basis, so you can keep tabs on your IntelliApp, ensuring it can always be completed quickly and easily, just as it was meant to be.
Devices, Drop-Out Screens, Browsers & Operating Systems – Last 7 Days
 These four pie charts show you a detailed count and percentage view of what devices your applicants are using when they apply, what screen(s) they’re most likely to drop out of during the application process, which browsers they’re using, and what operating systems they’re on.
These aggregates allow you to make well-informed decisions about your application to support your applicant base and grow your business. For example, if you know where people are dropping out of your application, you might consider making that section shorter. And if you know what devices and browsers your applicants are using, you can ensure your marketing content is optimized for those platforms.


