Speculation about the driver job market is never in short supply. The question of what’s happening is always an interesting one, and particularly relevant to us here at Tenstreet. We strive to provide the best services to our clients and the trucking industry when it comes to recruiting and thought the issue deserves closer inspection. We decided to look at the unique data we can access, and crunch the numbers. Here’s what we’re seeing across the Tenstreet platform:
Application Volumes
These numbers are based on all Tenstreet clients who have had a consistent IntelliApp volume for the past 13 months. We assigned January 2015 a value of 100 for comparison.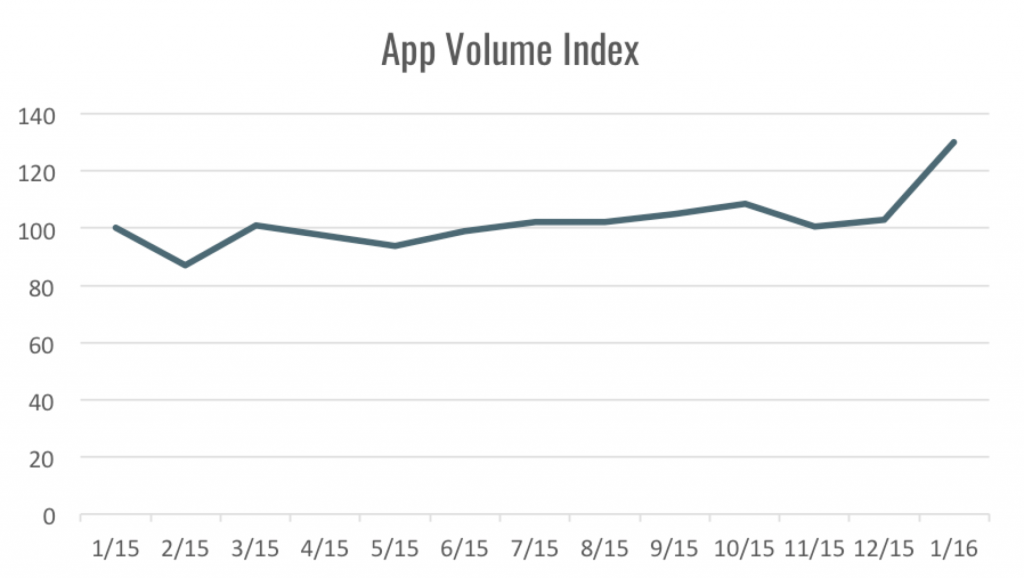
Here, you can see some counter-intuitive values. Typically, application rates tend to be high at the beginning of the year and during late spring/early summer. They gradually drop off until the holiday season, when the drop in the volume of applications tends to be most pronounced. Although some clients experienced that pattern, overall, it doesn’t apply to most carriers on our platform. We saw a much stronger early spring and summer season, and the holiday season also showed a much higher volume of applications than we started 2015 with. It’s true that not every carrier in the industry uses Tenstreet’s platform, but we do have a sizable enough portion of the industry to produce a reliable cross-section of the market. This makes our data both surprising and valuable to those looking to recruit drivers.
Driver Market Size
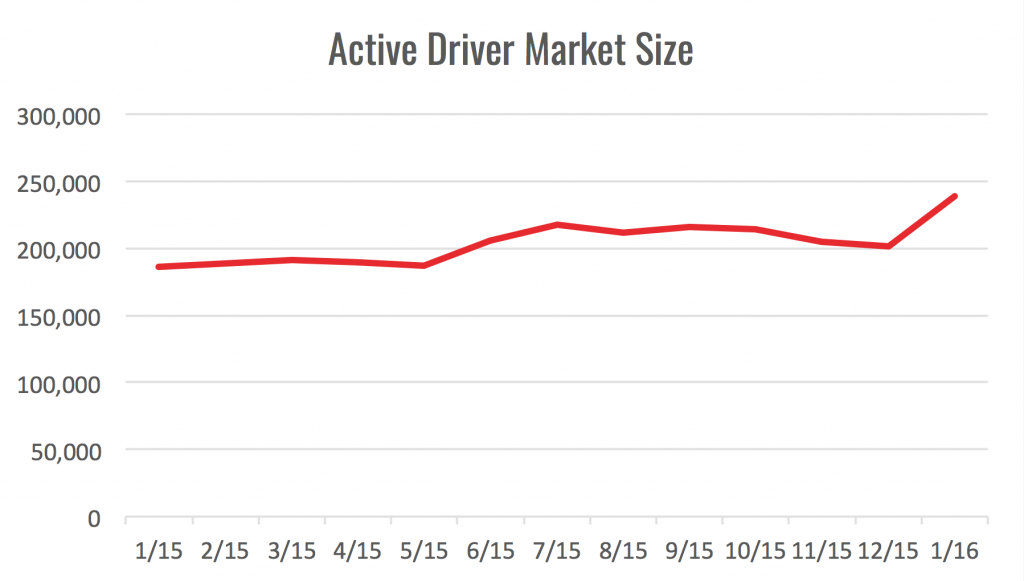 We also looked at the number of unique drivers in the market at any time. These numbers are important, because the difference between the number of unique drivers in the market and the number of carriers that a driver applies to indicates how seriously a driver is looking for new work or looking to make a change of carriers. Looking at the number of unique drivers searching for work over the course of the year, we see this:
"This makes our data both surprising and valuable to those looking to recruit drivers."
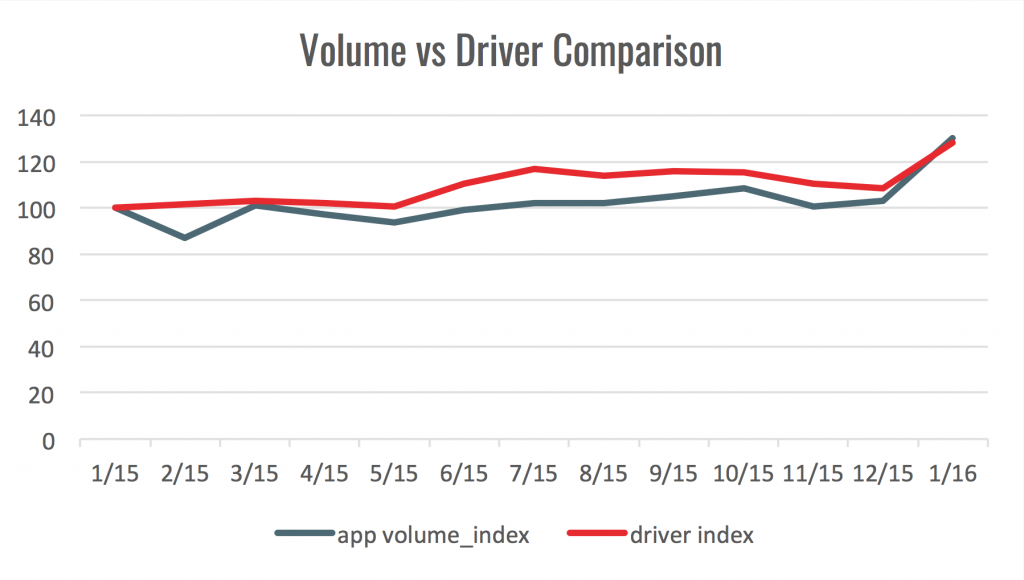 Generally, there is a relationship between the number of applications received by carriers and the number of drivers on the market, but not always. We saw an increase in both applications and drivers in the market during January, but last February the number of drivers stayed fairly consistent while the number of applications dropped. As these trends show, a carrier can neither take for granted that a drop in applications is a predictable consequence of the changing season, nor assume that fewer drivers are looking for work. There may be plenty of potential candidates in the market, but they are simply not applying to particular carriers. In this case, it’s vital for carriers to figure out not only why they’re losing driver interest, but also how to attract the drivers they’re looking for.
Mobile Applications
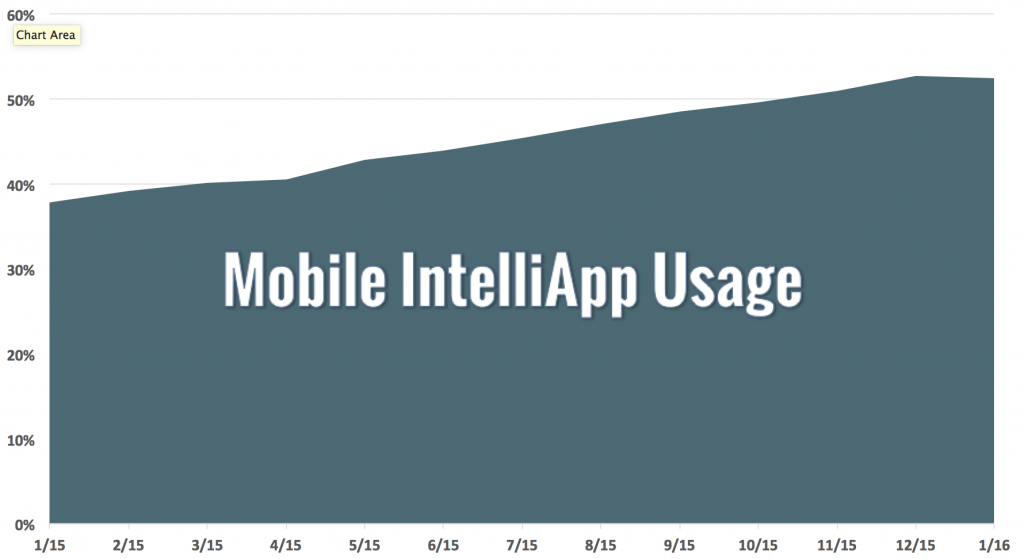 We’ve talked about this trend and its implications for your recruiting strategy before, and the prominence of mobile applications and communication continues to increase. We passed a tipping point late last year, when more than 50% of all IntelliApps through Tenstreet’s platform came from mobile devices. One reason the level of mobile activity is so prominent across Tenstreet’s platform is because of the IntelliApp feature, which allows candidates to auto-populate their applications. This saves drivers significant time and frustration trying to tap-type everything on a small cell phone screen. The overall numbers indicate that, increasingly, drivers prefer to use mobile devices and will take advantage of the opportunity to apply using mobile where it’s available.
"more than 50% of all IntelliApps through Tenstreet’s platform came from mobile devices"
After Hours Applications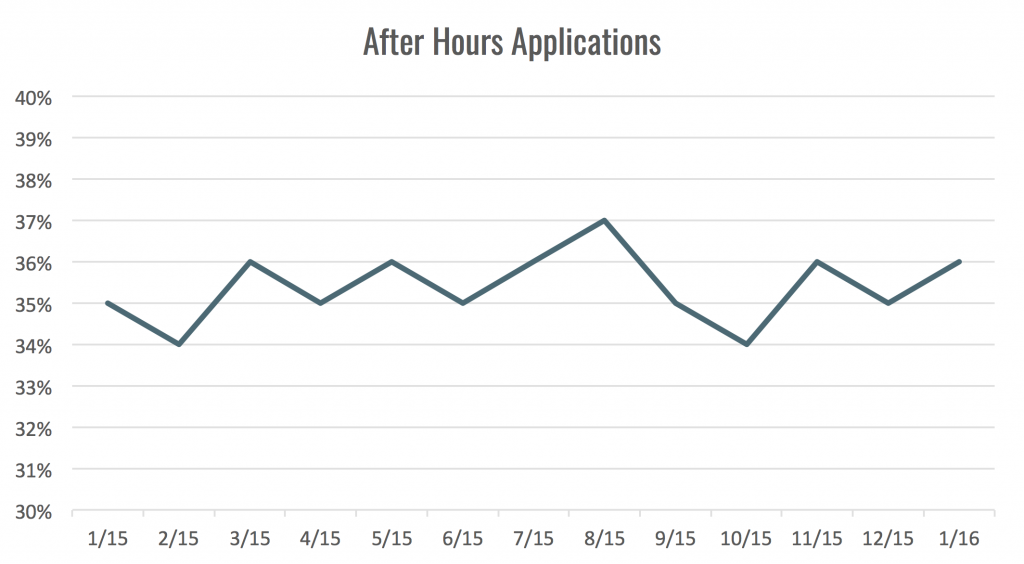
Clients vary a great deal, but the overall number of applications that come in after normal business hours is striking. This has major implications for recruiters. When a candidate sends out multiple applications, the company whose recruiters respond fastest more often than not ends up winning over the candidate. Many drivers submit their applications at nights and on weekends. Some of our clients receive 30–60% of their applications outside business hours, and this trend won’t disappear anytime soon. The volume of after-hours applications has remained steady for years. When drivers can submit applications at their leisure, at any time, from anywhere in the country, carriers will increasingly need to operate on “driver time” in order to remain competitive with recruiting.
"Some of our clients receive 30–60% of their applications outside business hours"
These charts hold valuable insight for carriers and their recruiting strategies. When it comes to so-called seasonal slumps or highs, it may be beneficial to better scrutinize your recruiting methods to see what other reasons might be causing you to see a sharp change in the number of driver applications, and that you can’t assume a lull in applications necessarily means that there are fewer drivers on the market. Better analyzing how and when your applications come in can also help you adapt to be more accessible to interested drivers by ensuring mobile applications are easy to submit, and that your recruiters are able to respond quickly to each application. Each of these trends, when taken into account, can help your business hire more of the drivers you really want.


